Casino Project
A Yukon-Based Project with Global Impact
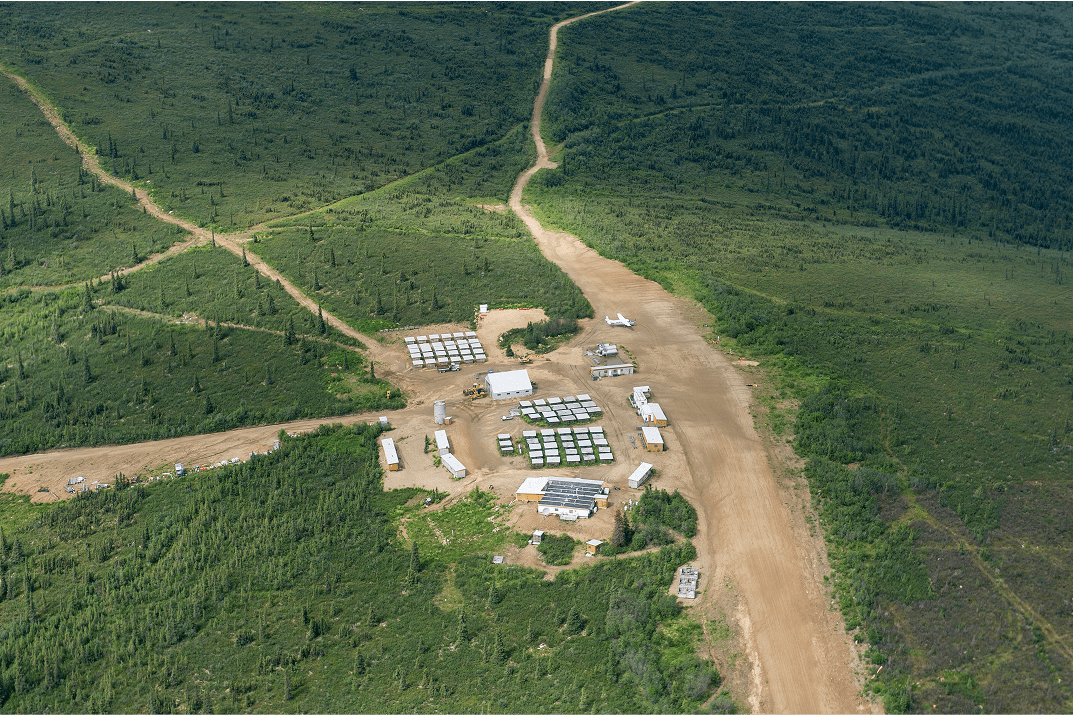
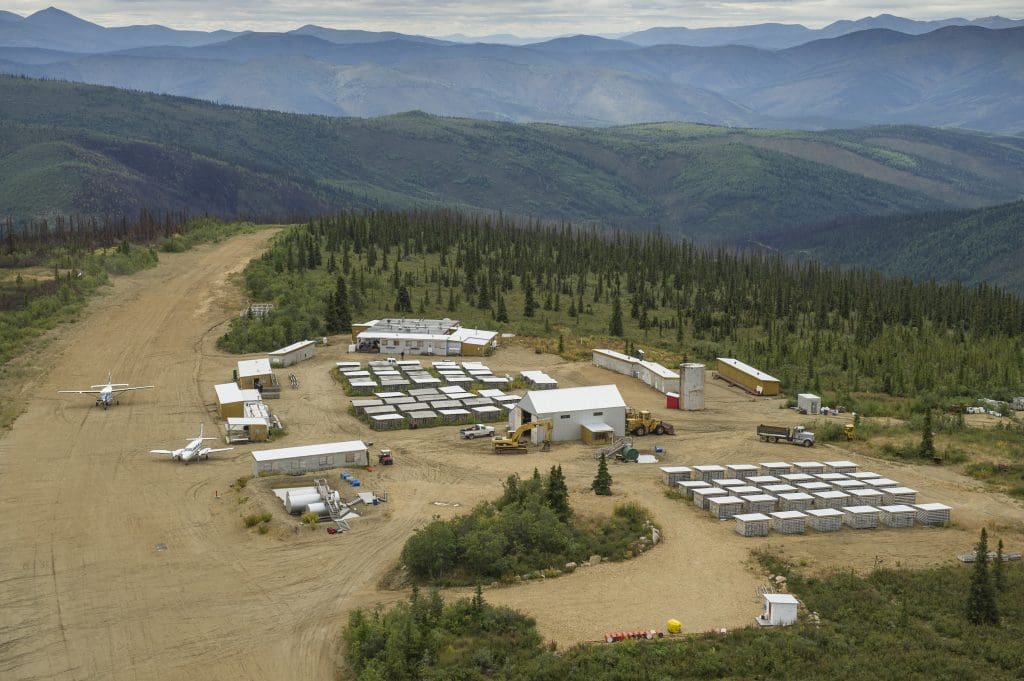
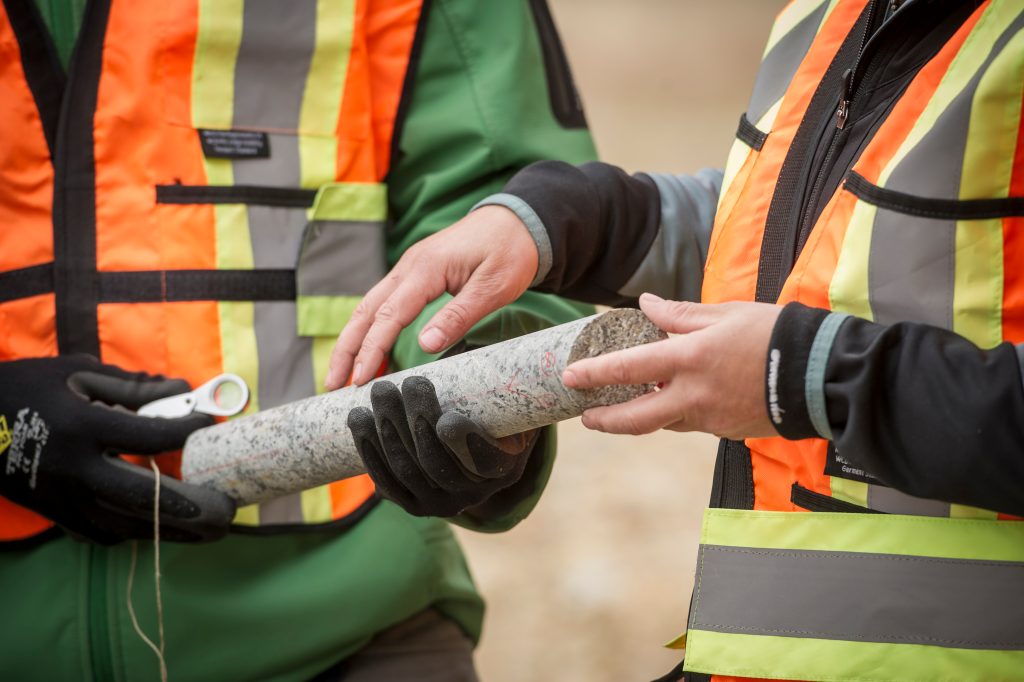
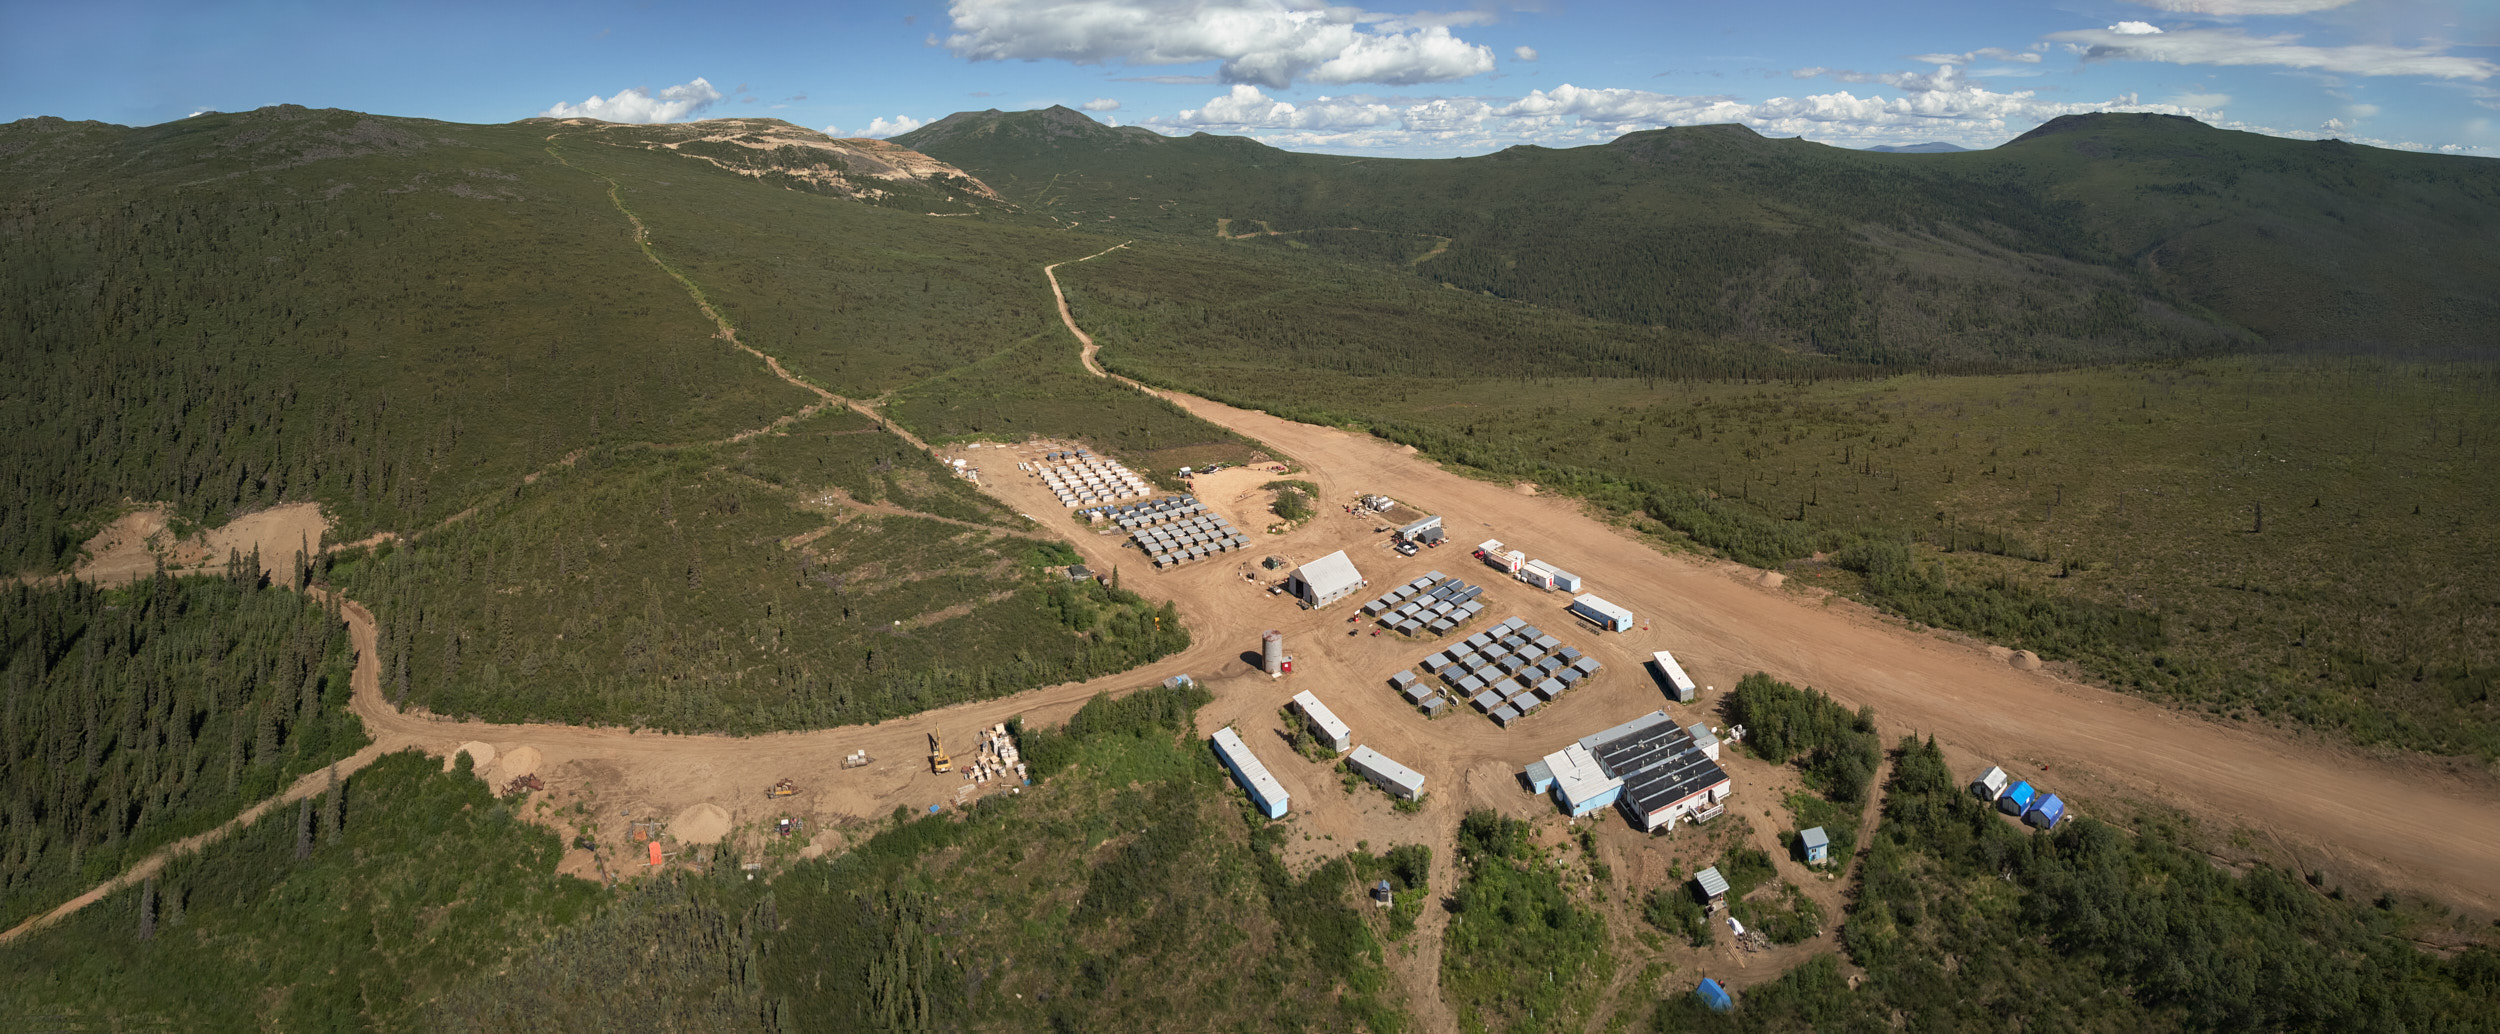
Western Copper and Gold is advancing the Casino Project: a globally significant, advanced-stage copper-gold-molybdenum-silver deposit in the Yukon, approximately 300k northwest of Whitehorse.
One of Canada’s largest undeveloped copper-gold projects
Casino Project Overview
2022 Feasibility Study Snapshot
Stage
Development (environmental assessment stage)
Mine Life
27 years
Mill: 120,000 tpd
Heap Leach: 25,000 tpd
Cu: 164 Mlbs
Au: 259 Koz
Ag: 1,392 Koz
Mo: 15 Mlbs
Critical minerals for a low-carbon future
Casino will deliver the minerals essential to electrification, resilient infrastructure, and national defence. These minerals power everything from EVs and clean energy to data centers and aerospace.
Casino’s significant gold content also provides a natural hedge, enhancing operational stability across commodity cycles.
Over its 27-year mine life, Casino is estimated to produce:
Copper
4.42 B lbs
“The metal of electrification”
Gold
7.1 M oz
Safe haven + inflation hedge
Molybdenum
407 M lbs
Critical for steel, defence, and energy
Silver
37.9 M oz
Clean energy tech + industrial use
Our commitment to environmental oversight
The Casino Project is currently undergoing YESAB Panel Review — the highest level of environmental and socio-economic assessment in the Yukon.
- The ESE Statement was submitted as planned in October 2025
- The process includes technical analysis, public hearings, and a final recommendation
- All development aligns with federal and territorial regulatory frameworks

Reserves & Resources
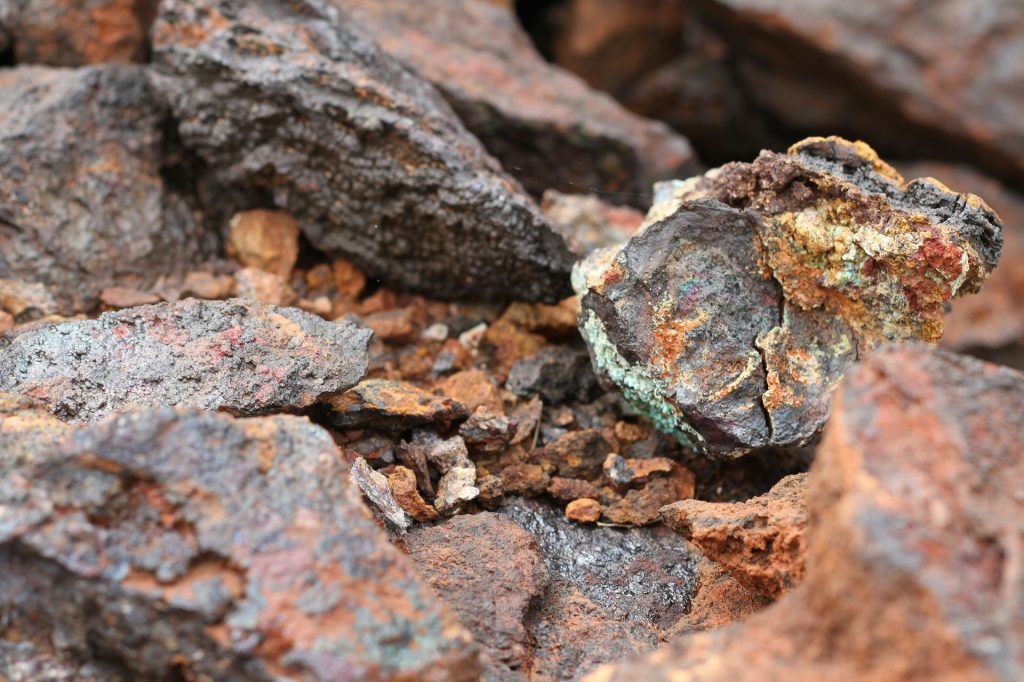
Casino boasts one of the largest copper-gold mineral reserves and resource endowments amongst development-stage mining companies globally.
Mill Reserve
| Class | Mt | NSR (C$/t) |
Copper (%) |
Gold (g/t) |
Moly (%) |
Silver (g/t) |
CuEq (%) |
Copper (M lb) |
Gold (M oz) |
Moly (M lb) |
Silver (M oz) |
|---|---|---|---|---|---|---|---|---|---|---|---|
| Proven | 140.1 | 38.50 | 0.31 | 0.39 | 0.024 | 2.1 | 0.67 | 944 | 1.8 | 74.9 | 9.4 |
| Probable | 1,076.9 | 23.68 | 0.17 | 0.19 | 0.021 | 1.6 | 0.36 | 4,135 | 6.7 | 497.1 | 55.5 |
| P&P | 1,217.1 | 25.38 | 0.19 | 0.22 | 0.021 | 1.7 | 0.40 | 5,079 | 8.5 | 571.9 | 64.9 |
Heap Leach Reserve
| Class | Mt | NSR (C$/t) |
Gold (g/t) |
Copper (%) |
Moly (%) |
Silver (g/t) |
AuEq (g/t) |
Gold (M oz) |
Copper (M lb) |
Moly (M lb) |
Silver (M oz) |
|---|---|---|---|---|---|---|---|---|---|---|---|
| Proven | 42.9 | 22.52 | 0.45 | 0.055 | n/a | 2.7 | 0.47 | 0.62 | 51.8 | n/a | 3.7 |
| Probable | 166.8 | 11.14 | 0.22 | 0.031 | n/a | 1.8 | 0.23 | 1.17 | 113.5 | n/a | 9.4 |
| P&P | 209.6 | 13.47 | 0.26 | 0.036 | n/a | 1.9 | 0.28 | 1.78 | 165.3 | n/a | 13.1 |
Notes
- The Mineral Reserve estimate has an effective date of June 13, 2022 and was prepared using the CIM Definition Standards (10 May 2014).
- Columns may not sum exactly due to rounding.
- Mineral Reserves are based on commodity prices of US$3.25/lb Cu, US$1550/oz Au, US$12.00/lb Mo, and US$22.00/oz Ag.
- Mineral Reserves amenable to milling are based on NSR cutoffs that vary by time period to balance mine and plant production capacities. They range from a low of $6.11/t to a high of $25.00/t.
- NSR value for supergene (SOX and SUS) mill material is NSR (C$/t) = $73.63 x recoverable copper (%) + $40.41 x gold (g/t) + $142.11 x moly (%) + 0.464 x silver (g/t), based on recoveries of 69% gold, 52.3% molybdenum and 60% silver. Recoverable copper = 0.94 x (total copper – soluble copper).
- NSR value for hypogene (HYP) mill material is NSR (C$/t) = $67.88 x copper (%) + $38.66 x gold (g/t) + $213.78 x moly (%) + $0.386 x silver (g/t), based on recoveries of 92.2% copper, 66% gold, 78.6% molybdenum and 50% silver.
- Mineral Reserves amenable to heap leaching are based on an NSR cutoff of $6.61/t.
- NSR value for leach material is NSR (C$/t) = $14.05 x copper (%) + $47.44 x gold (g/t) + $0.210 x silver (g/t), based on recoveries of 18% copper, 80% gold and 26% silver.
- AuEq and CuEq values are based on prices of US$ 3.25/lb Cu, US$ 1550/oz Au, US$ 12.00/lb Mo, and US$ 22.00/oz Ag, and account for all metal recoveries and smelting/refining charges.
- The NSR calculations also account for smelter/refinery treatment charges and payables.
Mill Resource
| Class | Mt | NSR (C$/t) |
Copper (%) |
Gold (g/t) |
Moly (%) |
Silver (g/t) |
CuEq (g/t) |
Copper (M lb) |
Gold (M oz) |
Moly (M lb) |
Silver (M oz) |
|---|---|---|---|---|---|---|---|---|---|---|---|
| Measured | 144.9 | 40.09 | 0.30 | 0.38 | 0.024 | 2.1 | 0.64 | 953 | 1.8 | 75.2 | 9.6 |
| Indicated | 2,114.2 | 20.34 | 0.14 | 0.16 | 0.015 | 1.4 | 0.29 | 6,493 | 11.1 | 716.0 | 93.5 |
| M&I | 2,259.0 | 21.60 | 0.15 | 0.18 | 0.016 | 1.4 | 0.31 | 7,446 | 12.9 | 791.2 | 103.1 |
| Inferred | 1,371.5 | 15.41 | 0.10 | 0.14 | 0.009 | 1.1 | 0.21 | 3,029 | 6.1 | 286.0 | 50.5 |
Heap Leach Resource
| Class | Mt | NSR (C$/t) |
Gold (g/t) |
Copper (%) |
Moly (%) |
Silver (g/t) |
AuEq (g/t) |
Gold (M oz) |
Copper (M lb) |
Moly (M lb) |
Silver (M oz) |
|---|---|---|---|---|---|---|---|---|---|---|---|
| Measured | 43.3 | 23.79 | 0.44 | 0.05 | n/a | 2.7 | 0.47 | 0.62 | 51.5 | n/a | 3.7 |
| Indicated | 188.4 | 11.47 | 0.21 | 0.04 | n/a | 1.7 | 0.23 | 1.27 | 145.4 | n/a | 10.4 |
| M&I | 231.7 | 13.77 | 0.25 | 0.04 | n/a | 1.9 | 0.27 | 1.88 | 196.9 | n/a | 14.1 |
| Inferred | 40.9 | 11.33 | 0.20 | 0.05 | n/a | 1.4 | 0.22 | 0.27 | 46.9 | n/a | 1.9 |
Total Resource (Mill + Heap Leach)
| Class | Mt | NSR (C$/t) |
Copper (%) |
Gold (g/t) |
Silver (g/t) |
Copper (M lb) |
Gold (M oz) |
Silver (M oz) |
|---|---|---|---|---|---|---|---|---|
| Measured | 188.2 | 36.34 | 0.24 | 0.40 | 2.2 | 1,005.0 | 2.4 | 13.3 |
| Indicated | 2,302.6 | 19.61 | 0.13 | 0.17 | 1.4 | 6,638.1 | 12.4 | 103.9 |
| M&I | 2,490.7 | 20.88 | 0.14 | 0.18 | 1.5 | 7,643.1 | 14.8 | 117.2 |
| Inferred | 1,412.5 | 15.30 | 0.10 | 0.14 | 1.2 | 3,075.5 | 6.3 | 52.3 |
Notes
- The Mineral Resources have an effective date of 29 April 2022 and the estimate was prepared using the definitions in CIM Definition Standards (10 May 2014).
- All figures are rounded to reflect the relative accuracy of the estimate and therefore numbers may not appear to add precisely.
- Mineral Resources that are not Mineral Reserves do not have demonstrated economic viability.
- Mineral Resources for leach material are based on prices of US$3.50/lb copper, US$1650/oz gold and US$22/oz silver.
- Mineral Resources for mill material are based on prices of US$3.50/lb copper, US$1650/oz gold, US$22/oz silver, and US$12.00/lb molybdenum.
- Mineral Resources are based on NSR Cutoff of C$6.61/t for leach material and C$6.11/t for mill material.
- NSR value for leach material is NSR (C$/t) = $15.21 x copper (%) + $50.51 x gold (g/t) + $0.210 x silver (g/t), based on copper recovery of 18%, gold recovery of 80% and silver recovery of 26%.
- NSR value for hypogene sulphide mill material is NSR (C$/t) = $73.81 x copper (%) + $41.16 x gold (g/t) + $213.78 x moly (%) + $0.386 x silver (g/t), based on recoveries of 92.2% copper, 66% gold, 50% silver and 78.6% molybdenum.
- NSR value for supergene (SOX and SUS) mill material is NSR (C$/t) = $80.06 x recoverable copper (%) + $43.03 x gold (g/t) + $142.11 x moly (%) + $0.464 x silver (g/t), based on recoveries of 69% gold, 60% silver and 52.3% molybdenum. Recoverable copper = 0.94 x (total copper – soluble copper).
- Mineral Resources are reported in relation to a conceptual constraining pit shell in order to demonstrate reasonable prospects for eventual economic extraction, as required by the definition of Mineral Resource in NI 43-101; mineralization lying outside of the pit shell is excluded from the Mineral Resource.
- AuEq and CuEq values are based on prices of US$3.50/lb copper, US$1650/oz gold, US$22/oz silver, and US$12.00/lb moly, and account for all metal recoveries and smelting/refining charges.
- The NSR calculations also account for smelting and refining charges and payables.
One of Canada’s largest undeveloped deposits
Casino’s mineral reserve and resource consists of two distinct material types: Mill Material suitable for conventional flotation processing, and Leach Material suitable for heap leach recovery.
Mill Material
Includes three mineralized zones – supergene oxide (SOX), supergene sulphide (SUS), and hypogene sulphide (HYP).
Leach Material
Consists of oxide-dominant leach cap (LC) mineralization, with heap leaching focused primarily on gold recovery.
Advanced development. Exceptional scale.
The 2022 Feasibility Study outlines an open-pit operation with a 27-year mine life, featuring a dual-processing approach utilizing both conventional milling and heap leach facilities.
Casino’s Proven and Probable Mineral Reserves consist of:
Mill Reserve
1.22 billion tonnes at 0.19% copper, 0.22 g/t gold, 0.021% molybdenum, and 1.7 g/t silver
Heap Leach Reserve
209.64 million tonnes at 0.26 g/t gold, 0.036% copper, and 1.9 g/t silver
An engine for economic growth & prosperity
A 2025 economic impact study conducted by MNP LLP highlights the substantial cumulative economic effect that developing the Casino Project will have on the Yukon and Canada.
Throughout construction, 27 years of operations, and reclamation, Casino is estimated to contribute:
- C$44.1 B to Canada’s GDP
- C$12.4 B in wages + salaries across Canada
- C$12.8 B in taxes + royalties to various governments
Casino offers a generational opportunity to anchor economic growth and prosperity in the North.
Right project. Right time.
Through focused execution, Western Copper and Gold has significantly de-risked Casino while steadily advancing toward development.